




Introduction – Netweb Technologies Quarterly Results
Watching the company, Netweb technologies quarterly results makes it one of the most clearer ways of knowing the direction of change in the company’s business.
Looking at the share price can be even more misleading as it moves every day, but the quarterly figures reveal what is really going on. They show the sales Netweb achieved, how profitable it was, if margins increased and the rate of growth of its AI operation.
The most recent results available are for Q1 FY27, for the quarter ending 30 June 2026. Netweb generated operating revenue of ₹819.69 crore, compared to ₹301.21 crore in the same quarter 1 year earlier, representing a year-over-year growth of 172.13%. Net income grew to ₹85.32 crore, representing a growth of 179.92% from 1 year previous when it was ₹30.48 crore.
This quarter was even more important as the revenues largely came from company’s AI business. The AI Systems said for around ₹510.57 crore (62.29% of operating revenue) and went up 484.2% YoY. AI business had order book of around 2,507 crore (as on June 30, 2026).
Note: This is a blogpost and we are not financial advisors. The article is purely for learning and providing information. It is not a buy and sell recommendation for Netweb Technologies shares.
Table of Contents
What can the quarterly results tell investors?
A quarterly result is more than a revenue and profit figure.
For Netweb Technologies, investors should look at several things together:
- Revenue growth
- Profit growth
- EBITDA
- Operating margin
- PAT margin
- EPS
- AI Systems revenue
- Order book
- Cash flow
- Management commentary
Considering all these statistics makes it a much better indicator as to whether the company actually improving.
For example, revenues can increase quickly and margins decline. This would give very different indications from revenues and margins both being optimized.
Latest Netweb Technologies Quarterly Result
The most recent quarter of report is Q1 FY27 announced on July 2026.
| Metric | Q1 FY26 | Q1 FY27 | YoY Change |
| Operating incomes. | ₹301.21 crore | ₹819.69 crore | +172.13% |
| EBITDA margin | 14.87% | 14.70% | Slightly lower |
| Profit before taxation (PBT) | ₹41.61 crore | ₹114.14 crore | +174% |
| Net profit | ₹30.48 crore | ₹85.32 crore | +179.92% |
It was clearly a great result to have from a growth perspective.
Revenues more than doubled, and profit was almost three times what it had been. The minor change in operating margin is also interesting, as it demonstrates that the business didn’t just grow sales by a large factor; it grew them whilst experiencing largely similar margin.
AI Systems Was the Main Growth Driver
What we could take away most from this result was how the AI Systems business was performing.
Netweb:sold through AI Systems a revenue of around 510.57 crore in Q1 FY27. This division accounted for 62.29% of the operating revenue and grew 484.2%.
The other two major growth pillars also remained important:
- HPC[2]: awith^renU a sum of around occurred.
- Private Cloud : to be between 116.42 Crore to 154.30 Crore.
Somewhat surprisingly, Netweb should not rely on only one product range. Yet it must be noted that AI has definitely paved the way for the past most dynamic growth.
The Order Book
As of 30 June 2026, Netweb was said to have an order book of.
That’s an important number because it provides some visibility to investors of what’s to come.
However, an order book mustn’t be mistaken to represent assured future gains.
The key questions are:
- How soon will these be delivered?
- What kind of margins will these projects bring?
- Are new orders being received as the existing orders are completed?
- How does the proportion of the large individual projects in the order book?
- When does the booked work generate cash?
Therefore, even the progression of order-book should always be taken into account in parallel to the quarterly gross revenue is.
Looking Back: Q3 FY26
Netweb’s Q3 FY26 outcome was already a significant improvement.
For the quarter ended December 31, 2025, the company reported:
- Operating Income of Rs.804.93 crore
- Operating EBITDA of ₹97.95 crore
- Operating EBITDA margin: (12.2%)
- 73.31 crore PAT result
- 9.0% PAT margin.
Revenue grew 141% YoY and PAT 146.7%.
Additionally, the company also completed a substantial strategic order of approximately Rs. 450.39 crore in that quarter, to enhance India’s AI compute infrastructure. AI Systems contributed to approximately 64.2% of Q3 revenue.
That quarter gives us relevant context for the most recent result: the remarkable AI-driven growth wasn’t just a one off quarter.
Q2 FY26 Was a Different Picture
The quarter was not the first indication of sharp increase.
In Q2FY26Netwebl reported operating income of nearly Rs 303.72 crore, an increase of 21% annually, with operating EBITDA of Rs 45.46 crore and a margin of 15%. PAT was approximately Rs 31.43 crore.
So the big leap for Q3 requires some explanation.
Another important event happening in Jan 2004 was the early execution of one large strategic order in the previous quarter. This order turned out to be hugely beneficial for the revenue in that quarter. An independent research report mentioned that Q3 revenue came out above estimate due to the success of early execution of one strategic mega order.
That is the reason I said that comparing quarters without knowing the business is not necessarily right.
Q1 FY26: Where the Recent Growth Cycle Started
Q1 FY26 already was significantly better than FY25.
Netweb reported:
- Operating income: Rs. 301.2 crore
- EBITDA: 44.8 crores
- EBITDA margin: 14.9%
- PAT: Rs 30.5 crore
- PAT margin: 10.1%
The operating profit increased with a break up of 101.7% compared to last year, while the PAT doubled.
The company’s management mentioned artificial intelligence as a key growth area at the same time. Currently, AI constitutes roughly 29% of the operations revenue, and its annual growth rate is around 300%.
This makes the branching very interesting.
The contribution from AI shifted from having the smallest business FYE26 to the biggest revenue contributor by Q1 FY27.
The Bigger Quarterly Trend
If you combine the above results demonstrate that how much Netweb business development has changed.
| Quarter | Revenue | PAT | Key Development |
| Q1 FY26 | ₹301.2 Cr | ₹30.5 Cr | Steady, robust growth commences |
| Q2 FY26 | ₹303.7 Cr | ₹31.4 Cr | Steady growth |
| Q3 FY26 | ₹804.9 Cr | ₹73.3 Cr | Executing grand strategic order |
| Q1 FY27 | ₹819.7 Cr | ₹85.3 Cr | AI Systems reigns supreme |
The Q3 and Q1 FY27 numbers are most relevant because these figures illustrate the extent to which Netweb can scale when large AI or HPC projects are running.
Likewise, investors should not expect to see such results in every quarter ahead. The timing of projects can have quite a substantial impact from quarter to quarter.
Netweb Technologies Quarterly Results: Q2 FY26 to Q1 FY27
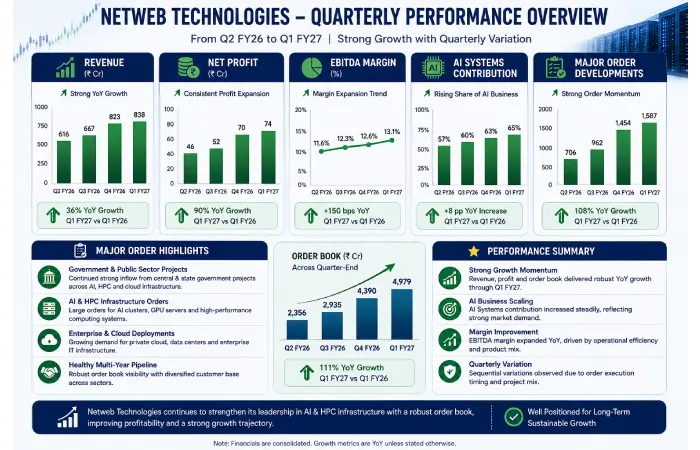
The quarterly figures reveal another intriguing story of Netweb Technologies. Growth remained relatively stable through the first half of FY26, then surged in Q3 as significant strategic initiatives were implemented. The March quarter maintained momentum, and Q1 FY27 resulted in another substantial leap.
Hence it is more important to analyze the results quarter by quarter than to judge the company by one anomalously good period.
Q2 FY26: Steady Growth
Compared to subsequent quarters, the quarter of September 2025 proved to be relatively stable.
Netweb reported:
- Revenue: Rs. 303.72 crore
- Operating EBITDA: 45.46 crore.
- EBITDA margin: 15.0%
- APAT: crore.
- PAT margin: 10.3%
- Diluted EPS: ₹5.55
Revenue was up by 21.0% YoY and PAT was up by 19.8%. In comparison to Q1 FY26, revenue was only up by 0.8%, indicating the business had not yet reached the much larger scale seen in the following quarters.
The quarter was still healthy. Actually, EBITDA rose even faster than sales with 25.1%, aided by operating margin.
Q3 FY26: A Major Step Up
Quarter December 2025 This was the quarter where the numbers started to take a significant turn.
Netweb reported:
- 1214. Operating Revenue=₹804.93 Crores.
- Operating EBITDA: which was already providing 2x coverage due to its high operating leverage.
- The margin of EBITDA was 12.2%
- PAT: Rs.73.31 crores.
- PAT margin of 9.0%:This is the Operating Profit to turnover ratio.
- Diluted EPS: ₹12.94
Revenue were up 141% YoY, PAT was also up 146.7%. Revenue were also 165% higher than Q2 FY26.
Why the abnormal big jump?
Netweb reported the successful implementation of a significant strategic order, and AI Systems made up nearly 64.2% of the Q3 FY26 revenue.
So this quarter should not be simply annualized and assumed to be a normal quarterly run rate.
Q4 FY26: Growth Remained Strong
By the quarter end of 3/2026 the revenue was below the Q3 level again, however still significantly higher than the same quarter 12 months ago.
Netweb reported:
- Revenue: 773.70 crore4
- EBITDA: 106.81 crores
- PAT (Profit after tax): ₹70.59 crore
- EPS: ₹12.43
Revenue increased 86.59% YoY, while PAT increased 64.19%. EBITDA increased 71.53%.
This quarter helps because Q3 did not turn out to be just a dead-cat-bounce.. Revenue is still above 770 crore in Q4, although well below the anomalously high Q3.
Q1 FY27: Another Record Quarter
The June 2026 quarter was another landmark.
Netweb reported:
- Sales Revenue: 819.6 crores
- PATI : Rs 85.32 crores
- Additional observed characteristics of the share: Revenue growth: 172.13% YoY
- 2)PAT growth:179.92% YoY; -499.11% QoQ.
- EBITDA (利润)= 390 USD (only shown here to give a rough idea). EBITDA margin: around 14.7%.
The company called it the best quarter ever in quarterly revenue and profit. The management team called it an achievement because of continue demand and delivery across the businesses and major contribution from AI.
The figures are of significance as the revenue for this period was higher than the Q3 FY26 and Q4 FY26, demonstrating the fact thatNetwebwider scale was not constrained to the December quarter.
Quarterly Comparison
Here’s the bigger picture:
| Metric | Q2 FY26 | Q3 FY26 | Q4 FY26 | Q1 FY27 |
| Revenue | ₹303.7 Cr | ₹804.9 Cr | ₹773.7 Cr | ₹819.6 Cr |
| PAT | ₹31.4 Cr | ₹73.3 Cr | ₹70.6 Cr | ₹85.3 Cr |
| YoY Revenue Growth | 21.0% | 141.0% | 86.6% | 172.1% |
| YoY PAT Growth | 19.8% | 146.7% | 64.2% | 179.9% |
| EBITDA Margin | 15.0% | 12.2% | ~13.8% | ~14.7% |
| EPS | ₹5.55 | ₹12.94 | ₹12.43 | — |
Information was obtained from: company filings, and reported quarterly financial data.
What this table highlights is that revenue growth has been much more robust, but margins can swing from one project mix to the next.
Why Q3 and Q4 Need to Be Read Together
If only considering Q3 it could be misleading.
Q3 revenue was around ₹805 Crores and followed by ₹774 Crores in Q4. That’s a sequential decline, but Q4 still grew almost 87% compared to Q4 FY25.
This indicated a move to a much greater quarterly level than the first half of FY26.
And for investors, surely that’s more important than trying to establish whether Q4 was higher or lower than Q3.
EPS Growth
EPS offers investors another metric to look at how the earnings story is unfolding.
Q3 FY26 diluted EPS at ₹12.94 is better than Q3 FY25 at ₹5.27. Q4 FY26 EPS at ₹12.43 is better than Q4 FY25 at ₹7.57.
A significant reason that led to a sign. increasing of EPS.
However, investors should compare EPS growth with the share price. If the share price rises much faster than EPS, valuation can become stretched.
Margins Tell a Different Story
The revenue growth has been really good but that hasn’t translated into an upward trend on the margins.
Q2 FY26: 15.0% EBITDA margin Q3: 12.2% FY26 Q1 FY27: ~14.7%
This is obviously not indicative of a deterioration in profitability.
Large strategic projects (when measuring the margin against the normal business of the company) can have different margins. The real question is whether Netweb can keep healthy margins in the course of implementing the project.
That’s quite something to keep an eye on each quarter.
Management Commentary and Business Developments
A further useful element of the earnings picture is the management comments on strategic orders.
In Q2 FY26 Netweb revealed the conclusion of 2 large strategic orders (~₹2184cr) scheduled to be fulfilled in FY27. Netweb boasted they were significant projects for the AI computing infrastructure of India.
Generally, a considerable strategic order has led to the spike of revenue by Q3 and AI Systems took about 64.2% of quarterly revenue.
This highlights how quickly large projects can have a dramatic effect on Netweb’s quarterly figures.
It also gives investors an important question to follow:
Will the company be able to sustain its winning streak and fulfill big orders after the current projects are done?
What Information Do We Have Regarding Cash Flow and the Balance Sheet?
Profit per quarter is just one aspect of the story.
Working capital can be important for an IT and computer infrastructure company as the inventory, equipment, and receivables from the customer can tie up cash as the business develops.
Netweb’s financial position has been reasonably comfortable. The Q3 FY26 release showed net debt as negative70 ”-₹190.08 crores, which essentially would mean that the company had net cash at the time of filing..
That offers a bit of financial padding as the business grows.
However, investors would do well to examine operating cash flow, receivables and inventory in subsequent filings rather than conclude that the company’s robust balance sheet will stay flat forever.
What Investors Should Watch in the Next Quarter
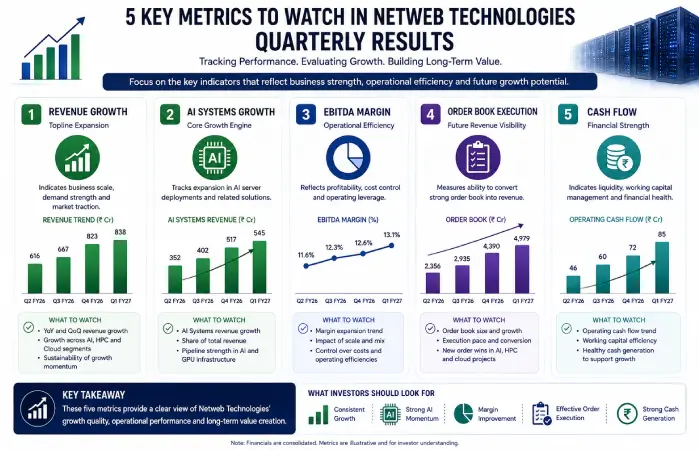
The next set of results should be judged on a few simple questions:
Is revenue still expanding rapidly?
A slowdown wouldn’t necessarily be undesirable, but the extent of the slowdown would.
AI Systems growth if not, why not?
This has become the company’s key driver of growth.
Are margins holding up….
Healthy sales are worth more when they generate healthy profits.
Is the orderbook being filled back up?
A big job can help a quarter up. Fresh new orders on a continuous basis would tell a much stronger story of sustainable demand.
Is profit becoming cash?
This is especially relevant as the company grows its infrastructure business.
What Investors Should Watch in Future Netweb Technologies Quarterly Results
The results for the latest Netweb Technologies quarter show a company growing at an incredible pace, and we will see in the next few quarters whether the growth can be maintained.
Q1 FY27 was the best for Q1! Revenue amounted to €819.6 crore (up by 172.13%Y/Y) and PAT to 85.32 crores (up by 179.92%Y/Y). Revenue from AI Systems was worth 510.57 crores (i.e. 62.29%) and order book at 30 June 2026 was about 2507 crores.
The question for investors today is no longer “will next quarter be ‘good’”. A better one to ask is “can Netweb sustain these results in the quarter without losing margins, cash flows or execution.”
The Five Numbers That Matter Most
You don’t have to go through the whole quarterly report to find the related areas. Here are the five areas that you can use to start looking.
Revenue Growth
Revenue shows how fast the business is growing.
Recent numbers show a major change:
- Q2 FY26: approximately Rs 303.7 crore
- Q3 FY26: approximately Rs. 804.9 Crore
- Q4 FY26: around for 773.7 crore
- Q1 FY27: approximately Rs.819.6 crore
Q3 was boosted due to early execution of a strategic mega order, as per an independent research analysis.
This amount implies that, assuming investors’ existing expectations are accurate, a minimum of Rs800+ crore would turn into the company’s usual quarterly earnings.
What is important is whether the company can maintain this level as it progress into FY27.
AI Systems Growth
This is by far the most important number for Netweb at this stage.
The AI Systems segment represented around 62.29% ofQ1, FY27 income grew by 484.2% year (YoY).
Prior to FY26, contribution was far less significant. Revenue share of AI Systems in H1 FY26 was 25.4% versus 14.7% in H1 FY25.
It is a big change.
Future results should answer three questions:
Is AI revenue seen to be leveling off?
Is the new AI orders replacing the finished jobs?
Are they bringing in healthy margins?
If the answer is “yes” then the long run growth story has a positive outlook.
EBITDA Margin
Revenue growth can appear massive yet the breakeven point appears just as practicable, eg, big but unprofitable.
This is why EBITDA margin becomes relevant.
Netweb’s quarterly EBITDA margins have moved around:
| Quarter | EBITDA Margin |
| Q2 FY26 | 15.0% |
| Q3 FY26 | 12.2% |
| Q4 FY26 | ~13.8% |
| Q1 FY27 | ~14.7% |
The decline in Q3 was partly due to the mix and timing of a large strategic order. Q1 FY27 saw a rebound toward the prior margin levels of the company.
For investors, the ideal combination is simple:
Fueling is very high revenue growth + stable or even improving margins. (Magnifies the effect of increased revenue, high margins improve the bottom line).
If revenue is increasing yet margins are continually declining, approach the quality of the growth with greater suspicion.
Order Book and Pipeline
As on June 2026, Netweb had a book order size of approximately 2,507 crores.
The company has also revealed much larger opportunities at the pipeline level. An ICICI Securities update after Q1 FY27 spoke of a pipeline of around. On the other hand, earlier the firm had announced two major strategic orders worth about to be executed through FY27.
But investors need to keep three terms separate:
Pipeline–Business prospects.
Order book: Business booked already.
Sales: – The revenue which a business actually earn and recognize.
A growing pipeline is motivating. A growing order book is also better. What ultimately matters is the regular conversion of these orders into profitable revenues.
Cash Flow
This is the metric that can get lost in the rush that can come at times of hyper-growth.
A company can report strong accounting profits while cash remains tied up in:
- Inventory
- Receivables
- Project-related working capital
In previous model, netweb’s operating cash flow would increase three times more sharply with scale of business, yet working-capital management is equally critical.
For future quarters, investors should compare:
PAT 7 vs. cash flow from operations7
If profits are increasing, and cash generation is getting better also, then that is more of a healthy sign.
How Quarterly Results Can Affect the Share Price
The stock doesn’t always behave in the same direction as reported profit.
They’re implicitly comparing the result to expectation.
For example:
Strong Result + Lower Than Expected
A company’s results can be fantastic but the stock will decline if the market had high expectations and the fundamentals didn’t live up to it.
Strong Result + Better Than Expected
This is the most suitable combination for market sentiment.
Weak Result + Low Expectations
The stock may not fall much if investors had already priced the weakness in.
So that’s why one should take a look at the analyst expectations and valuation of the company along with quarterly reports.
What Does a Good Signal Look Like?
Over the next few quarters, the following combination would strengthen the Netweb growth story:
- AI Systems continues the rapid growth.
- Revenue is still running at a higher level.
- Nonetheless, EBITDA margins continue to be healthy.
- Orders: The new orders backfilled the order book.
- The projects are completed on time.
- Cash flow from operating activities should improve.
- Customer concentration is decreasing.
There is not one quarter that has to be perfect.
This makes it useful to identify general trends from the results from several quarters that follow a consistent pattern.
What indicators should be warning signs?
Investors should become more cautious if several of these appear together:
- The diffusion of AI Systems further slows down.
- Revenue decreases for reasons outside the natural project progress.
- EBITDA margins fall for few quarters.
- Order-book increase is slowing.
- Large projects are annually postponed.
- Receivables, and inventory, increase far more rapidly than revenue.
- Although the profit is increasing, the inflow of cash is still far from convincing.
- Starting to see earnings forecasts heading in the downward direction.
One weak quarter would not be enough to overturn the investment thesis. Repeating the pattern would make a much bigger difference.
How to Read Netweb’s Results Like an Investor
A simple five-question checklist works well after every earnings release:
Revenue
Did the company expand?
AI Systems
Is the main machine of growth still growing?
Margins
Is the company earning sufficient profit for that growth?
Orders
Are the works-from of tomorrow taking the place of those finished?
Cash
Is the profit converted into cash?
If those 5 scores are positive over time, then the fundamental picture is getting stronger.
Frequently Asked Questions
How frequently does Netweb Technologies release quarterly results?
Netweb tends to be announced following the firm’s board-meeting schedule and schedule for exchange-disclosure. Investors may want to verify exact date of announced from latest NSE/BSE filing, or investor relations portion of firm’s own site.
What are the previous quarter numbers for Netweb Technologies?
Q1 FY27 For Q1 FY27, Netweb generated revenue of around Rs 819.6 crore and PAT around Rs 85.32 crore. Revenue grew by 172.13% YoY whereas PAT grew by 179.92% YoY.
What will be the plays of the minutes?
AI systems are by far the most significant growth segment. Generated around 62.29% of the Q1 FY27 revenue and grew 484.2% YoY.
We finally have stronger news, can one good quarter change the stock outlook?
Yes, but investors need to be cautious. success in the execution of big projects can lead to large variance in a company’s quarterly results. Many strong quarters in a row is a much more powerful signal than a single-quarter exceptional quarter.
I wonder whether I should buy Netweb Technologies Inc. after the great quarterly numbers.
3-month results are not all that is required. Investment decisions should also take into account valuation, willingness-to take risk, goals, future income streams, rivalry and long-term growth proposals.
Investment Disclaimer
Disclaimer: This information is for educational and informational purposes only.
This is not financial advice and no investment of buying or selling Netweb Technologies shares should be taken.
Results, share prices can be changing in every quarter and so constantly check on the company’s filings, NSE/BSE disclosures, financial results and Stock Market Data before taking any investment decision.
Conclusion
Netweb Technologies’ recent quarterly performance shows a business that has moved into a much larger scale.
Q1 FY27 was particularly strong, with revenue of about ₹819.6 crore, PAT of ₹85.32 crore, AI Systems contributing more than 62% of revenue, and an order book of approximately ₹2,507 crore.
But the real test begins now.
Investors need to see whether Netweb can maintain strong AI demand, execute its growing order book, protect margins, and turn accounting profits into cash.
The quarterly results page should therefore be treated as a live record of the company’s progress, not simply an archive of earnings numbers.
The most useful approach is to compare every new quarter with the previous one, the same quarter last year, and the expectations already built into the stock price.
That will tell you far more than simply asking whether Netweb’s profit went up or down.
Netweb Technologies Share Price Resource Hub
Learn everything about Netweb Technologies shares, including the latest share price, price targets, historical performance, stock analysis, quarterly results, and factors to consider before buying or selling the stock.